
Graph building
Text visualization: from unstructured data to verifiable AI answers
How modern text visualization techniques—from frequency charts to graph-based semantic networks—convert unstructured documents into structured knowledge graphs that power verifiable, traceable AI answers.
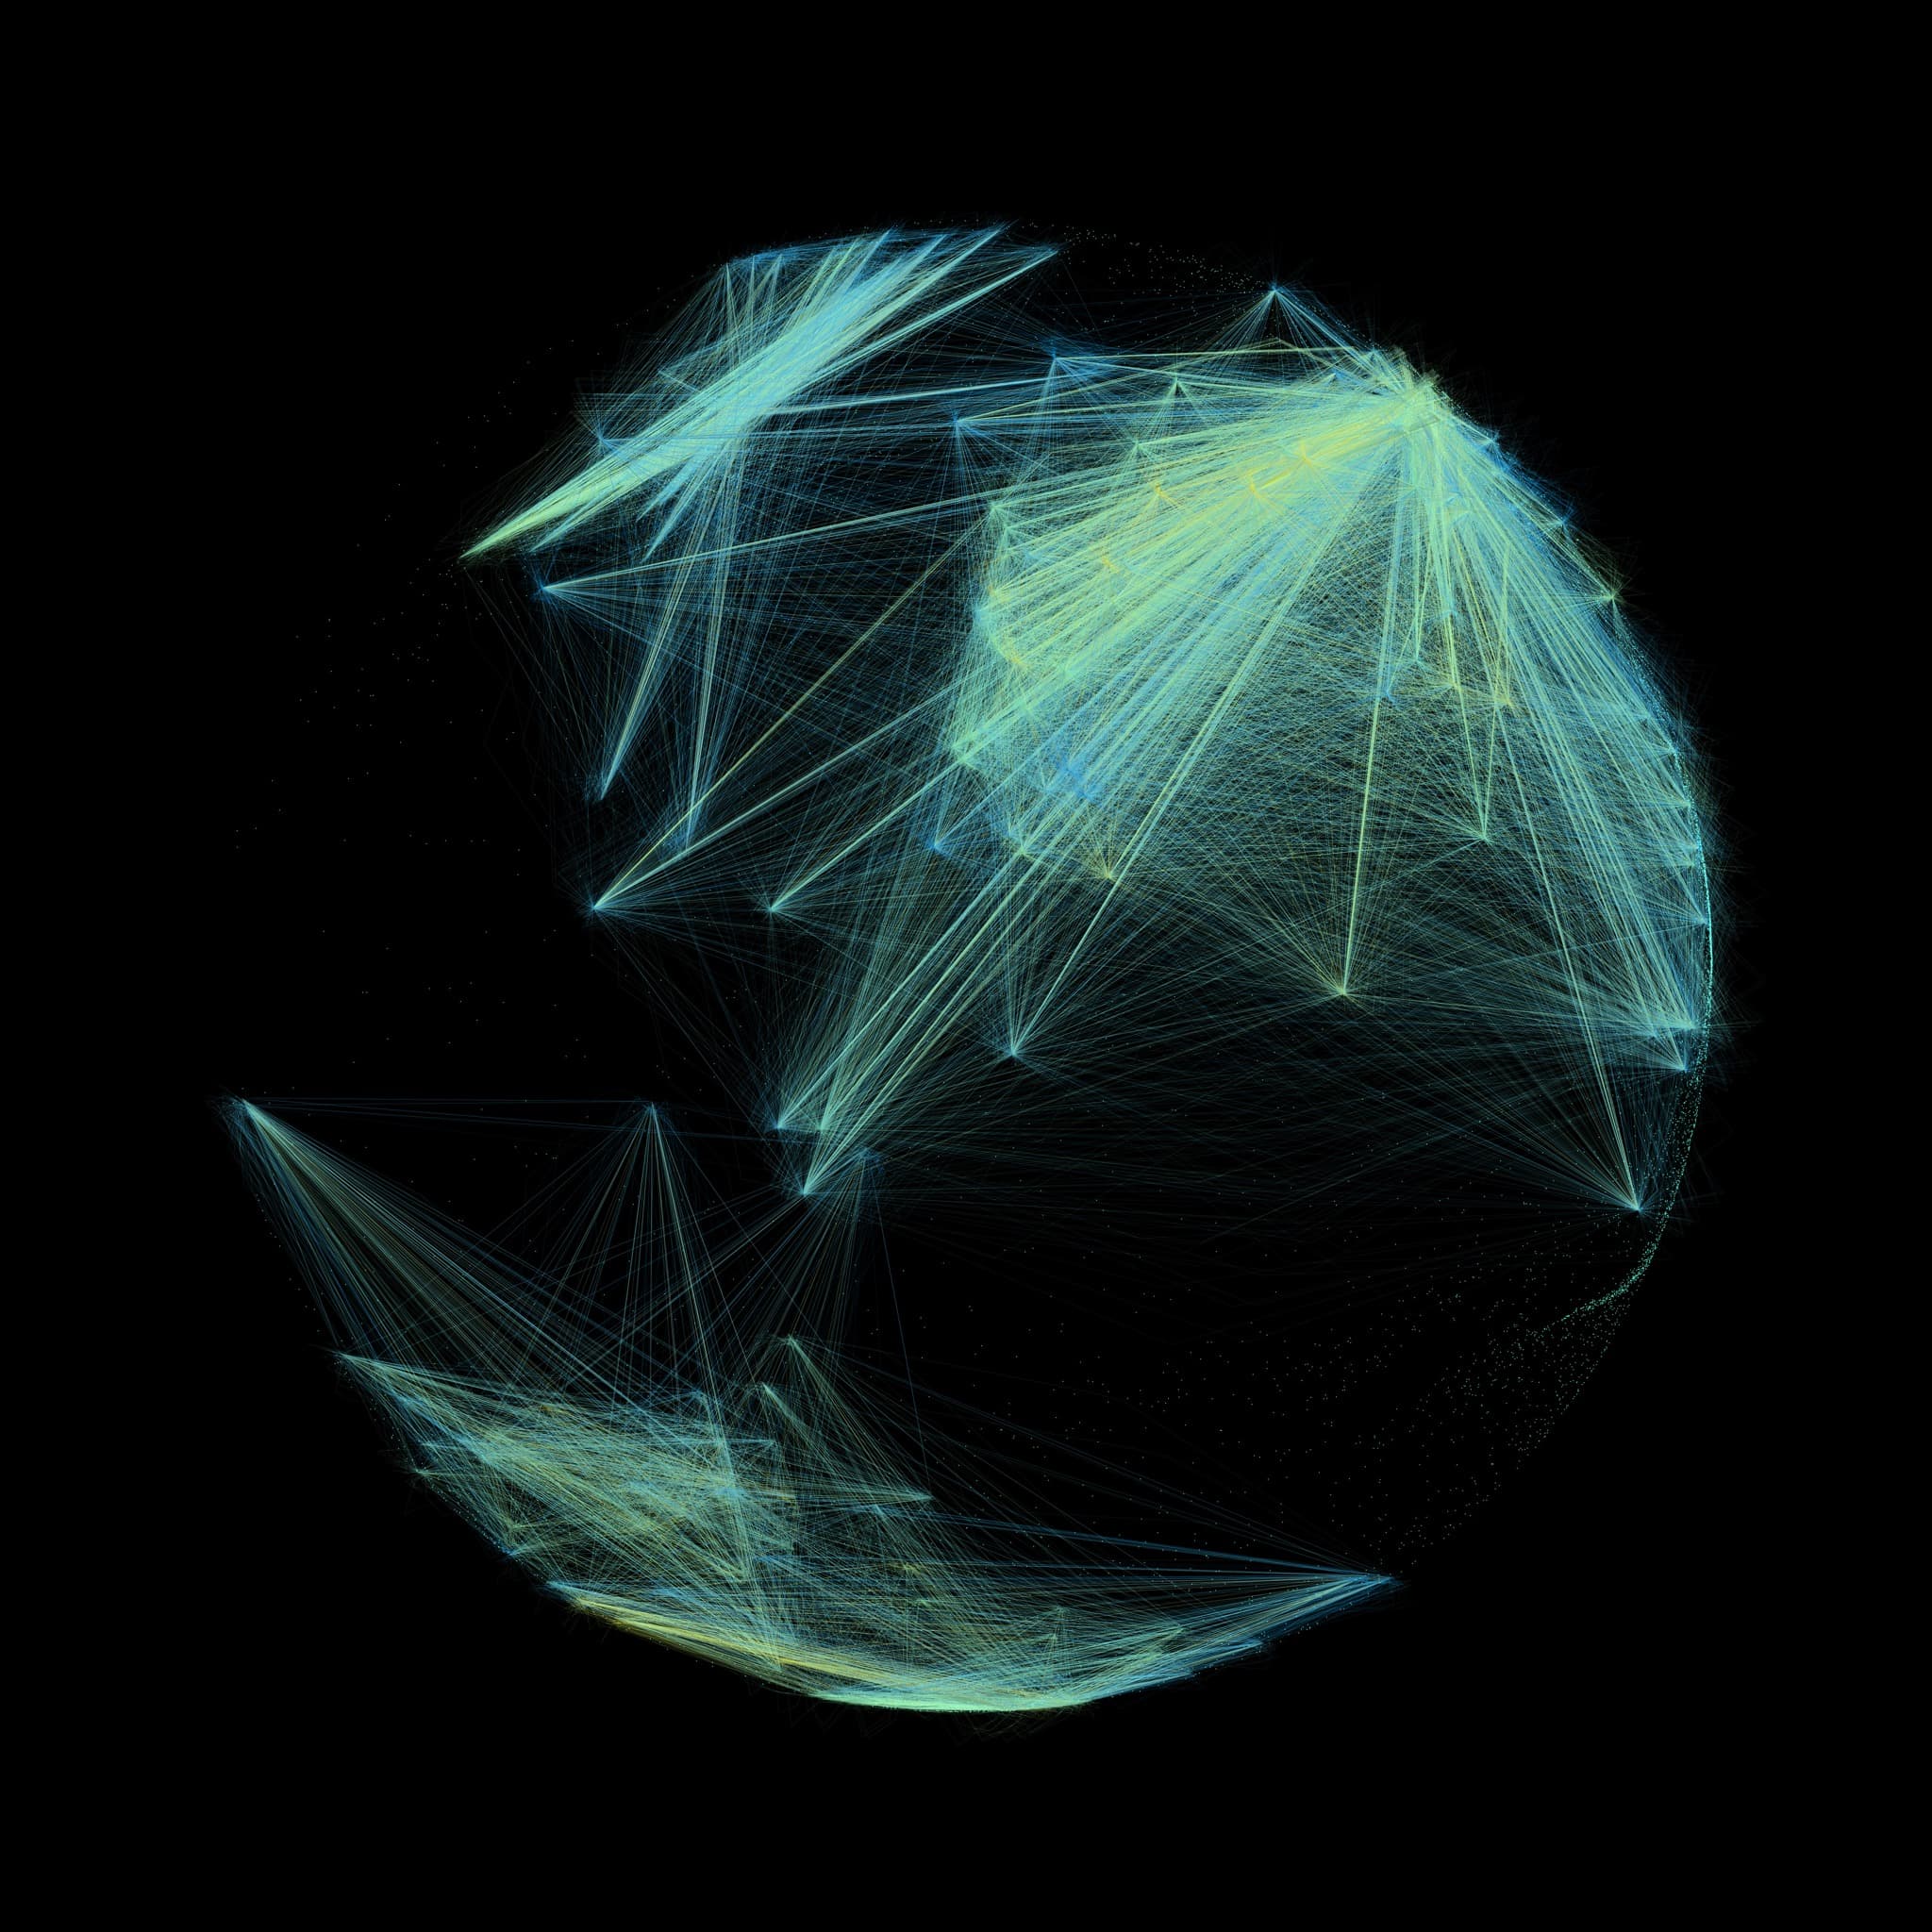
Transforming unstructured text into actionable insights requires more than basic data visualization. It demands a structural understanding of language. As enterprises process millions of complex documents, the need for advanced text visualization techniques that map semantic relationships has become a powerful tool for reliable AI. At Lettria Perseus, we address this by converting raw text into structured knowledge graphs, so AI systems deliver verifiable, traceable answers rather than probabilistic guesses. This article will guide you through these transformative methods.
Key takeaways: mastering text visualization for enterprise AI
-
Traditional vector-based text visualization strips critical context by flattening complex documents into mathematical arrays, losing the hierarchical and causal relationships essential for accurate AI responses
-
Graph-based text visualization preserves data structure by mapping text as interconnected nodes and edges, transforming static documents into dynamic, queryable networks that maintain semantic integrity
-
Perseus converts unstructured text into structured knowledge graphs with full traceability, allowing users to trace every AI answer back to specific source documents and graph paths for 100% auditability
-
GraphRAG delivers 30% more accurate results and 60% faster evidence-based research compared to traditional approaches by retrieving only existing verified data from knowledge graphs
Understanding text visualization and its challenges
Text visualization fundamentally bridges the gap between raw, unstructured data and human comprehension. However, processing complex enterprise documents presents serious architectural challenges. Historically, organizations have relied on traditional approaches that convert textual data into dense vector embeddings. While efficient for basic similarity searches, these vector-based systems lose critical context when flattening complex enterprise documents into mathematical arrays.
The main architectural challenges include:
-
Loss of hierarchical context during vectorization
-
Inability to map explicit causal links between entities
-
Over-reliance on superficial frequency metrics that miss semantic depth
When we visualize text using standard vector databases, we often strip meaning by converting data into vectors without preserving the intricate relationships between entities. A 1,536-dimensional vector might capture the general semantic proximity of a paragraph, but it fails to map the explicit hierarchical or causal links. This structural flattening means that when an AI model attempts to read and retrieve information, it pulls statistically similar text chunks rather than logically connected facts. If an analyst tries to read the text output, the lack of relational depth is a clear warning sign of potential inaccuracies.
Furthermore, traditional text visualization tools often default to superficial representations like word clouds or a basic frequency chart. These methods might highlight that a specific word appears 450 times in a dataset, but they provide zero insight into the semantic context. To build enterprise-grade AI, we must move beyond these limitations, remove ambiguous data representations, and adopt visualization techniques that maintain the structural integrity of the original corpus.
Core techniques for visualizing text data
To effectively analyze textual data, we must employ a spectrum of techniques ranging from basic statistical plots to complex semantic networks.
Foundational visualization approaches
Foundational text visualization techniques focus on lexical frequency and basic distribution patterns within a dataset. Common methods include a bar chart to display term frequency, where the x-axis represents specific words and the y-axis shows their occurrence count. Analysts often import data into Python and use libraries like NLTK to create these visual representations. You can easily add a chart title, adjust formatting, and set axis labels to make the figure clearer. For instance, word clouds might visually emphasize frequent terms by adjusting their size and color, or by setting a min threshold for word occurrences. However, they fail to capture syntax. Similarly, you can plot document clusters based on TF-IDF scores, helping analysts identify broad topic distributions. Yet, these foundational methods treat every word as an isolated data point, which leads to distorted or simply incomplete outputs.
Advanced graph-based and semantic representations
To overcome the limitations of a basic chart, modern text visualization relies on advanced network structures and semantic modeling. Unlike traditional visualization methods that isolate data points, knowledge graphs preserve data structure and relationships by mapping text as interconnected nodes and edges. This approach transforms a static document into a dynamic, queryable network.
For example, Perseus converts unstructured text into structured knowledge graphs with entities and relations, outputting formats optimized for graph databases. By utilizing a text-to-graph AI system, we can visualize exactly how a "Contractor" is linked to a "Deliverable" and apply specific node labels for clarity. This semantic representation allows us to explore complex patterns and dependencies that are otherwise invisible in standard data visualization formats. The industry is moving toward more robust visual models, and for good reason.
AI's role in generating verifiable answers
Artificial intelligence has revolutionized how we process and visualize text, shifting the paradigm from simple pattern recognition to deep semantic understanding.
AI-powered text analysis and feature extraction
Modern AI systems excel at parsing complex syntax to identify critical information within massive datasets. Advanced text-to-graph conversion extracts entities and relations while maintaining semantic context from documents. Instead of merely counting a word, these AI models utilize natural language processing to recognize entities based on surrounding context. By automating ontology generation, AI ensures that extracted features adhere to a strict schema, allowing organizations to visualize text data as a highly structured network. This is far superior to basic topic modeling. When you import text into these systems, they automatically assign the correct format and labels to every extracted word.
Ensuring verifiability and explainability
The most serious challenge with generative AI is the risk of fabricated information. GraphRAG eliminates hallucinations by retrieving only existing nodes and edges from graphs, strictly limiting the AI's context window to verified enterprise data. When a user queries the system, the AI traverses the visualized network to formulate its response. At Lettria, we provide full traceability by showing exact source documents and graph paths for answers. If an AI agent claims a specific compliance metric, the visual network allows users to trace that exact node back to the original written text, ensuring 100% auditability. You can easily read the exact document title and source paragraph, which is exactly the kind of transparency that high-stakes environments demand.
Strategic applications for enterprise knowledge
Deploying these advanced visualization and retrieval techniques unlocks powerful capabilities. Key use cases include enterprise knowledge graphs, agent memory, and intelligent RAG for complex documents. By structuring data relationally, organizations can power AI agents that retain contextual memory.
| Application | Traditional Vector Approach | Graph-Based AI Approach |
|---|---|---|
| Data Retrieval | Pulls statistically similar text chunks | Traverses exact semantic relationships |
| Accuracy | Prone to context loss and hallucinations | Delivers 30% more accurate results |
| Research Speed | Requires manual verification of sources | Enables 60% faster evidence-based research |
| Traceability | Opaque similarity scoring | Transparent node-to-document mapping |
Implementing these graph-based approaches ensures that enterprise AI systems operate with measurable precision.
Conclusion: empowering decisions with visualized text and AI
The evolution of text visualization from a basic frequency chart to complex semantic networks marks a critical turning point in enterprise data management. By moving away from flat vector embeddings and embracing relational data structures, organizations can finally extract the true value of their unstructured documents. Structured knowledge graphs transform AI from a creative assistant into a reliable corporate witness, capable of providing exact, verifiable answers backed by transparent evidence. As we continue to process increasingly complex datasets, tools like Lettria Perseus that build and visualize these semantic networks will be essential. Tethering AI to verifiable network structures ensures that business decisions are driven by accurate, traceable, and deeply contextualized insights.
Frequently asked questions
What is text visualization?
Text visualization is the process of converting unstructured written data into graphical representations to reveal patterns, frequencies, and semantic relationships. It ranges from basic word clouds to complex network structures that map intricate data dependencies.
How to visualize a text?
To visualize text, you must first import the dataset and process it using NLP tools like NLTK to extract every key word. You can then use libraries to create a bar chart for frequency distribution, add labels, adjust the color, and format the visual by setting a min threshold, or employ graph databases to display complex semantic networks.
What are the benefits of using AI in text visualization?
AI automates the extraction of complex features and relationships from massive datasets, reducing manual analysis time by hours or days. It enables dynamic, context-aware visualizations that showcase deep semantic patterns rather than just superficial word counts.
How does text visualization support verifiable AI answers?
Advanced graph-based visualization maintains audit trails by tethering every fact to entities within ontologies. By visually mapping the exact path from an AI-generated answer back to the specific node and source document, it ensures complete transparency and eliminates unverified hallucinations.